Doc, we have a problem.
Badges: HUD, The analyst, Dr. Who (2. attempt)
 Dashboards are cool!
In the never-ever-ending quest to improve our IoT-lives, we have identified the possibility to improve human sleep quality, by measuring vital data regarding to sleep, like sleep patterns and sleep environment.
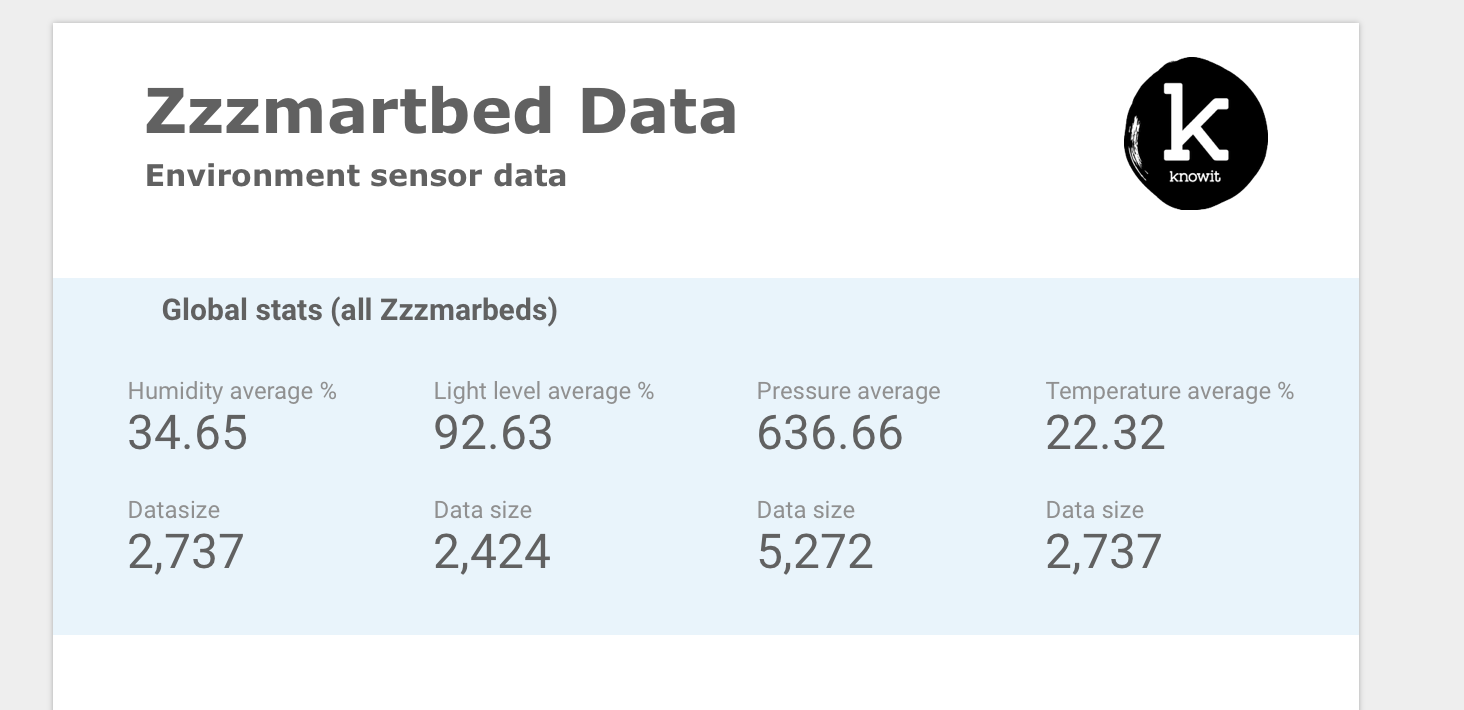
With the data gathered from all the sensors in the ZzzmartBed we are able to provide useful metrics to be used by medical staff, sleep doctors, scientists or other health employees that can have use for the data available for them.
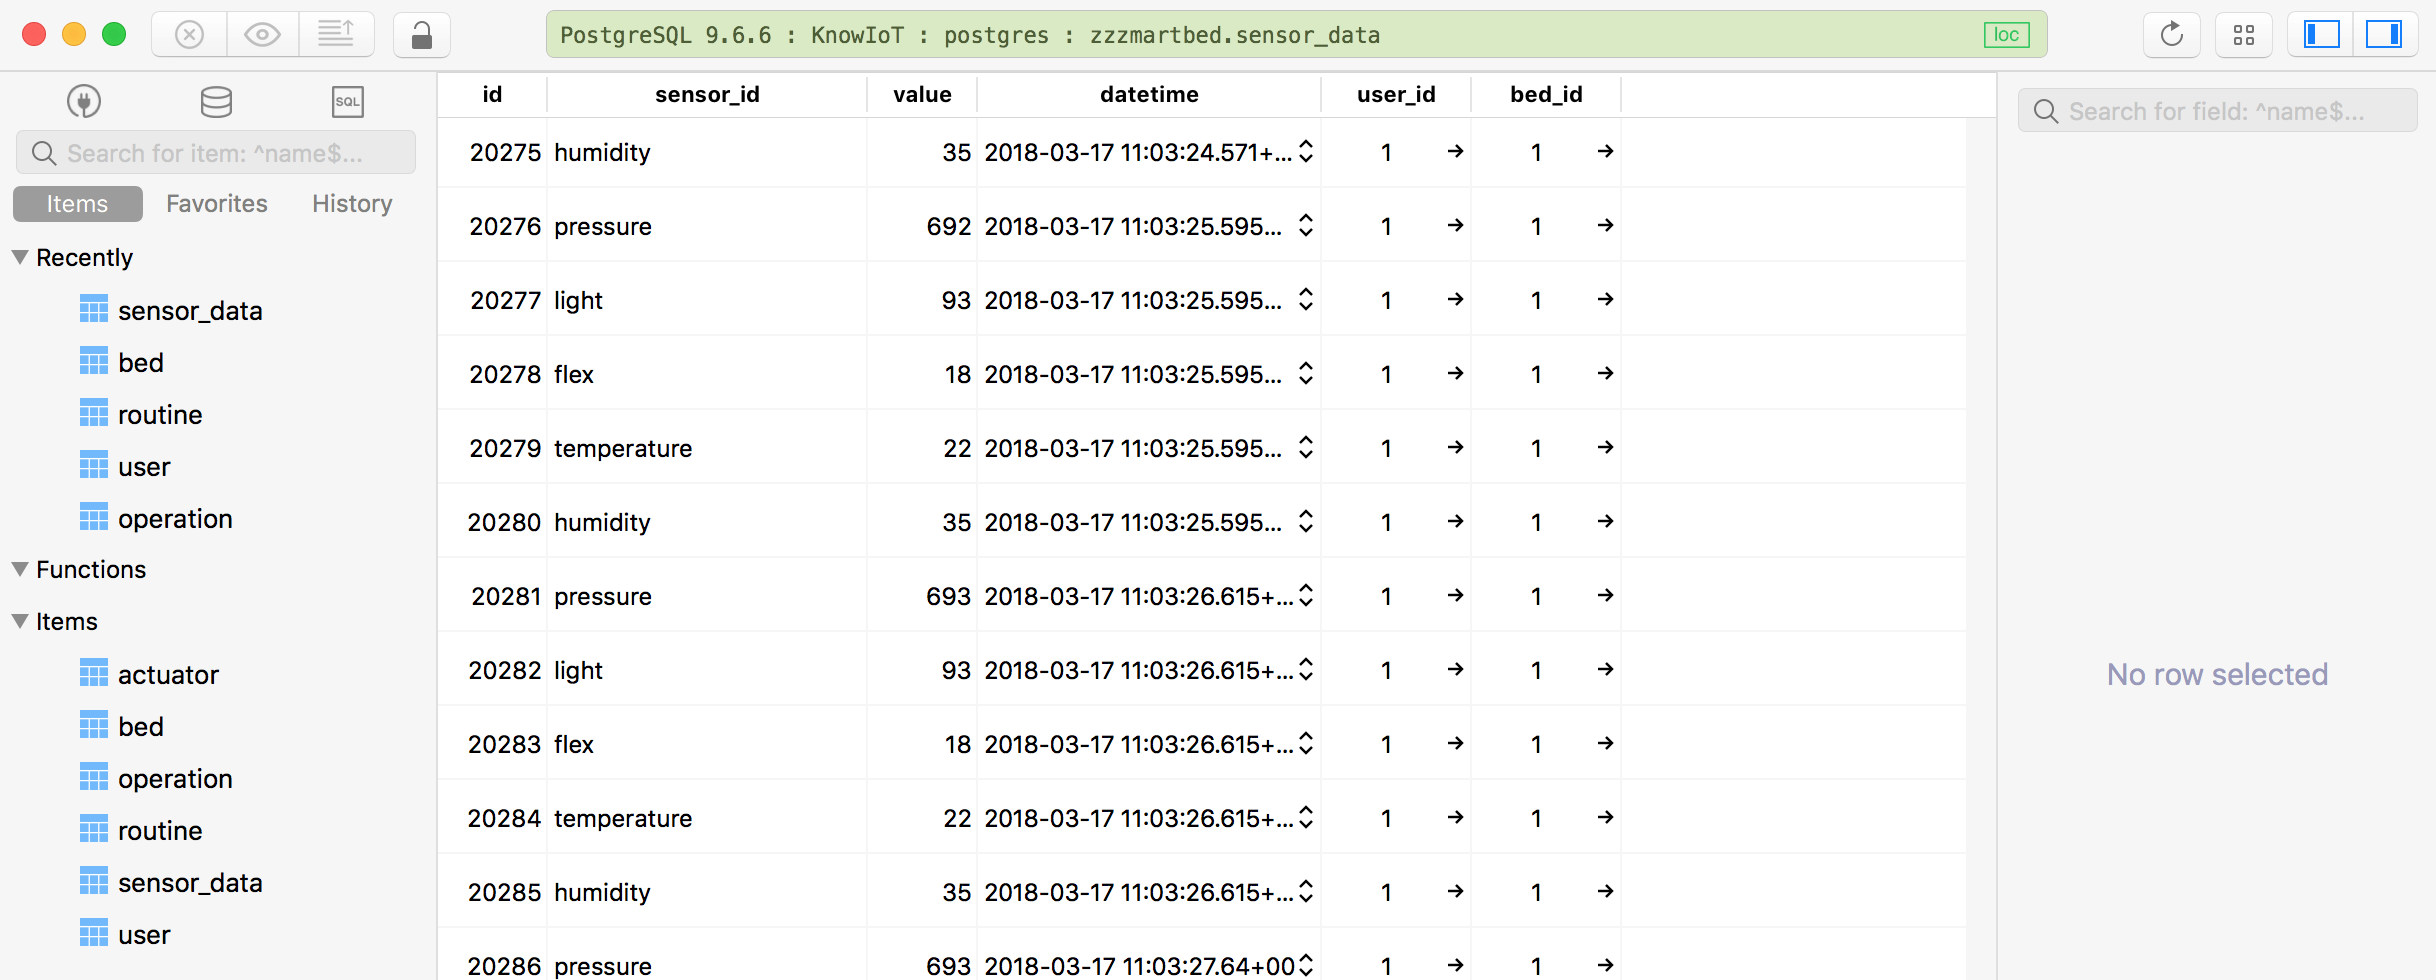 Some sql table data
We are fetching a lot of metrics from a continuous stream, and storing them into the cloud. From here, the data is displayed in real time in a neat Google Data Studio Dashboard. Within the different graphs and metrics, the user can from here drill down to see the neat details.
Instead of just telling, why don't you take a look at it yourself? Check it out here! https://datastudio.google.com/reporting/1MFJmnMfe7_tyOKoYXGciRatun3uMcFyc/page/2hBP